TradingView Review 2026: The Best Charting Platform?
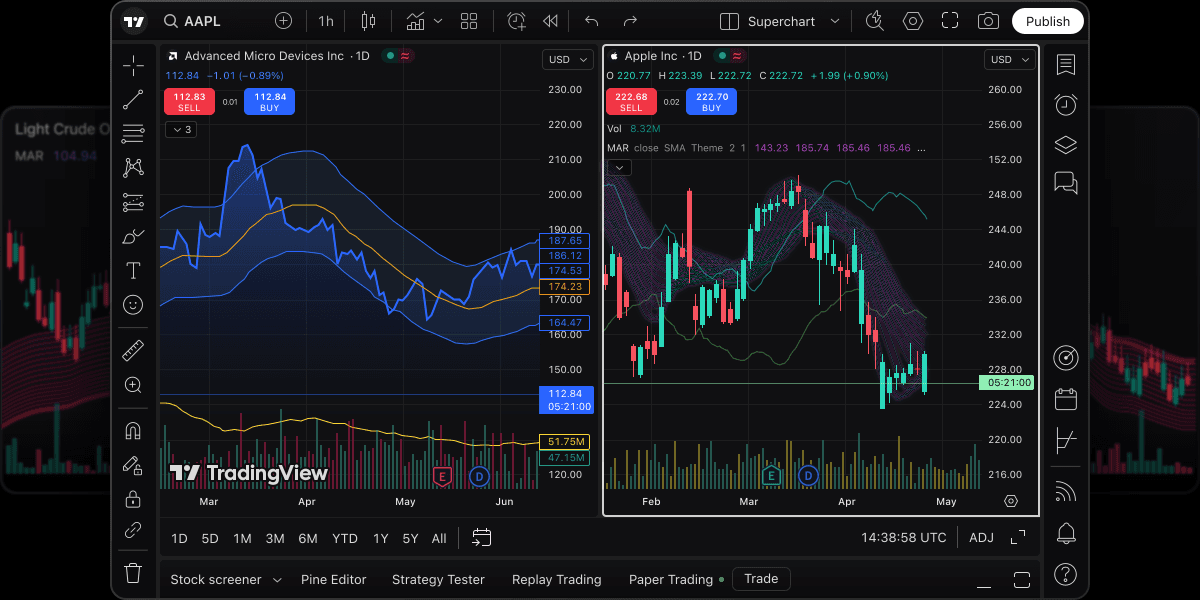
TradingView has become the gold standard for charting platforms, trusted by over 60 million traders worldwide. But is it worth your time and money? We put it through rigorous testing to find out.
Quick Verdict
TradingView
TradingView delivers the best charting experience available. The free tier is genuinely useful, and paid plans offer exceptional value for serious traders. It's our top pick for technical analysis.
What is TradingView?
TradingView is a web-based charting and social networking platform for traders and investors. Founded in 2011, it has grown to become the most popular technical analysis tool in the world.
Unlike traditional desktop software, TradingView runs entirely in your browser. Your charts, watchlists, and analysis sync across all your devices automatically.
Key Features
Advanced Charting Tools
TradingView's Supercharts platform offers institutional-grade charting:
- 400+ built-in indicators - Every standard indicator plus unique proprietary ones
- 100,000+ community indicators - Free scripts shared by other traders via Pine Script
- 12+ chart types - Candlestick, Heikin Ashi, Renko, Point & Figure, and more
- Drawing tools - Trendlines, Fibonacci, Gann, Elliott Wave labels
- Multi-timeframe analysis - Compare multiple timeframes on one screen
- Bar replay - Practice trading on historical data
Pine Script Programming
Pine Script is TradingView's proprietary programming language. It's simpler than Python but powerful enough to:
- Create custom indicators
- Build automated alert conditions
- Backtest trading strategies
- Share your tools with the community
Even non-programmers can learn the basics in a few hours.
Real-Time Alerts
Set alerts based on:
- Price levels
- Indicator conditions
- Drawing tool interactions
- Custom Pine Script conditions
Alerts notify you via app notification, email, SMS, or webhook. The webhook feature lets you connect to automated trading systems.
Paper Trading
Practice trading with virtual money directly on TradingView charts. Track your simulated P&L and refine your strategy without risking real capital.
Stock Screener
Filter stocks, crypto, forex, and futures using 150+ fundamental and technical criteria. Save custom screens and set alerts when stocks meet your conditions.
Social Network
TradingView has a built-in social platform where traders:
- Publish trading ideas with charts
- Follow successful traders
- Discuss strategies in comments
- Build reputation through accurate predictions
Pricing Plans
TradingView Pricing
Basic
- 1 chart per tab
- 3 indicators per chart
- 1 saved chart layout
- Delayed data (10-15 min)
- Basic alerts
- Ads displayed
Essential
- 2 charts per tab
- 5 indicators per chart
- 10 saved layouts
- Real-time data
- 10 active alerts
- No ads
- Volume profile
Plus
- 4 charts per tab
- 10 indicators per chart
- Unlimited layouts
- Real-time data
- 30 active alerts
- Intraday exotic charts
- Custom timeframes
- Extended hours data
Premium
- 8 charts per tab
- 25 indicators per chart
- Unlimited layouts
- 400 active alerts
- Second-based intervals
- All chart types
- Priority support
- 4x more historical bars
💡Save 16% with annual billing. Black Friday typically offers 60% off.
Which Plan Should You Choose?
- Basic (Free): Perfect for learning and casual chart viewing. Surprisingly capable.
- Essential: Best for most active traders. Real-time data and no ads justify the cost.
- Plus: For serious traders who need multiple charts and more alerts.
- Premium: For professionals managing complex multi-screen setups.
Detailed Pros and Cons
Pros
- Best-in-class charting - cleaner and faster than any competitor
- Massive indicator library - 100,000+ free community scripts
- Genuinely useful free tier - not a crippled trial
- Browser-based - no downloads, works on any device
- Pine Script - create custom indicators without complex coding
- Active community - 60M+ traders sharing ideas
- Paper trading built-in - practice without risk
- Regular updates - new features added monthly
- Excellent mobile app - full-featured, not dumbed down
Cons
- Premium pricing adds up - $600/year for top tier
- Social feed can distract from actual trading
- Some broker integrations are limited
- Can be overwhelming for complete beginners
- Delayed data on free tier (10-15 minutes)
Who Should Use TradingView?
Ideal For:
- Technical traders who rely on chart patterns and indicators
- Swing traders holding positions for days to weeks
- Day traders who need fast, reliable charts
- Options traders analyzing price action for entries
- Crypto traders - excellent coverage of crypto markets
- Beginners learning technical analysis (start with free tier)
Not Ideal For:
- Pure buy-and-hold investors who never look at charts
- High-frequency traders who need direct exchange feeds
- Fundamental-only investors who don't use technical analysis
TradingView vs Competitors
| Feature | TradingView | Thinkorswim | TrendSpider |
|---|---|---|---|
| Price | Free - $49.95/mo | Free (with Schwab) | $39 - $179/mo |
| Chart Quality | Excellent | Excellent | Excellent |
| Community Indicators | 100,000+ | Limited | None |
| Browser-Based | Yes | No (desktop app) | Yes |
| Learning Curve | Low-Medium | High | Medium |
| Best For | Most traders | Options traders | Automation |
Getting Started with TradingView
- Sign up for free - No credit card required
- Add your first symbol - Type any ticker in the search bar
- Explore indicators - Click "Indicators" and browse the library
- Save your layout - Customize and save your chart setup
- Try paper trading - Practice with the built-in simulator
Final Verdict
TradingView earns our highest recommendation for charting platforms. The combination of powerful features, active community, and genuinely useful free tier makes it the obvious choice for most traders.
Start with the free plan. You can always upgrade when you hit its limits - and many traders never need to.
Pro Tip
TradingView runs major sales on Black Friday (typically 60% off annual plans). If you know you want Premium, wait for the sale and lock in a full year.
Frequently Asked Questions
Is TradingView free?
Yes, TradingView offers a fully functional free tier. You get 1 chart per tab, 3 indicators, and delayed data. It's enough to learn and even trade with.
Is TradingView good for beginners?
Excellent. The interface is intuitive, and the free tier lets you learn without commitment. Start with basic charts and gradually explore more features.
Can I trade directly on TradingView?
Yes, TradingView integrates with select brokers for direct trading. Supported brokers include TradeStation, OANDA, and others. Paper trading is available for everyone.
Is TradingView worth paying for?
If you trade actively, yes. Real-time data, multiple charts, and no ads significantly improve the experience. The Essential plan at $12.95/month offers the best value.
Does TradingView work on mobile?
Yes, both iOS and Android apps are available. They offer nearly the same functionality as the web version, including drawing tools and indicators.
Further Reading
Disclaimer: This article is for informational purposes only and does not constitute financial advice, investment recommendations, or an endorsement of any particular security or strategy. Always conduct your own research and consult with a qualified financial advisor before making investment decisions. Past performance is not indicative of future results.
Enjoying this article? Get more like it.
No spam, unsubscribe anytime.
Written by
John SmithJohn is a financial analyst and investing educator with over 10 years of experience in the markets.